The weight, length, and diameter of mini tomatoes are important factors in many applications, such as food production and processing, agriculture, and market analysis. In order to better understand the characteristics of mini tomatoes, it is useful to examine a sample of the fruit and calculate various statistics, such as the mean, median, and standard deviation.
Recently, a sample of 275 mini tomatoes was measured for weight, length, and diameter. The following data was collected:
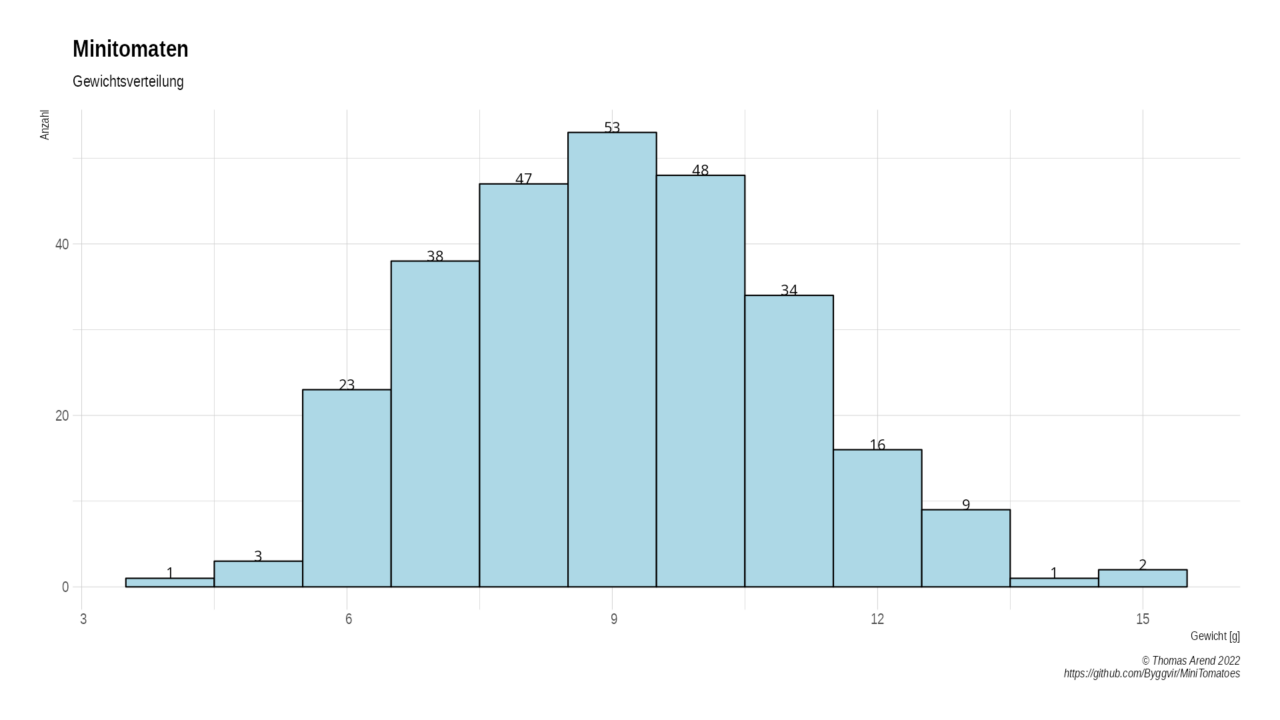
Mean weight: X = 9.0563 g
Median weight: 9.06 g
Standard deviation of weight: s = 1.9345 g
Mean length: X = 30.5103 mm
Median length: 30.20 mm
Standard deviation of length: s = 3.4971 mm
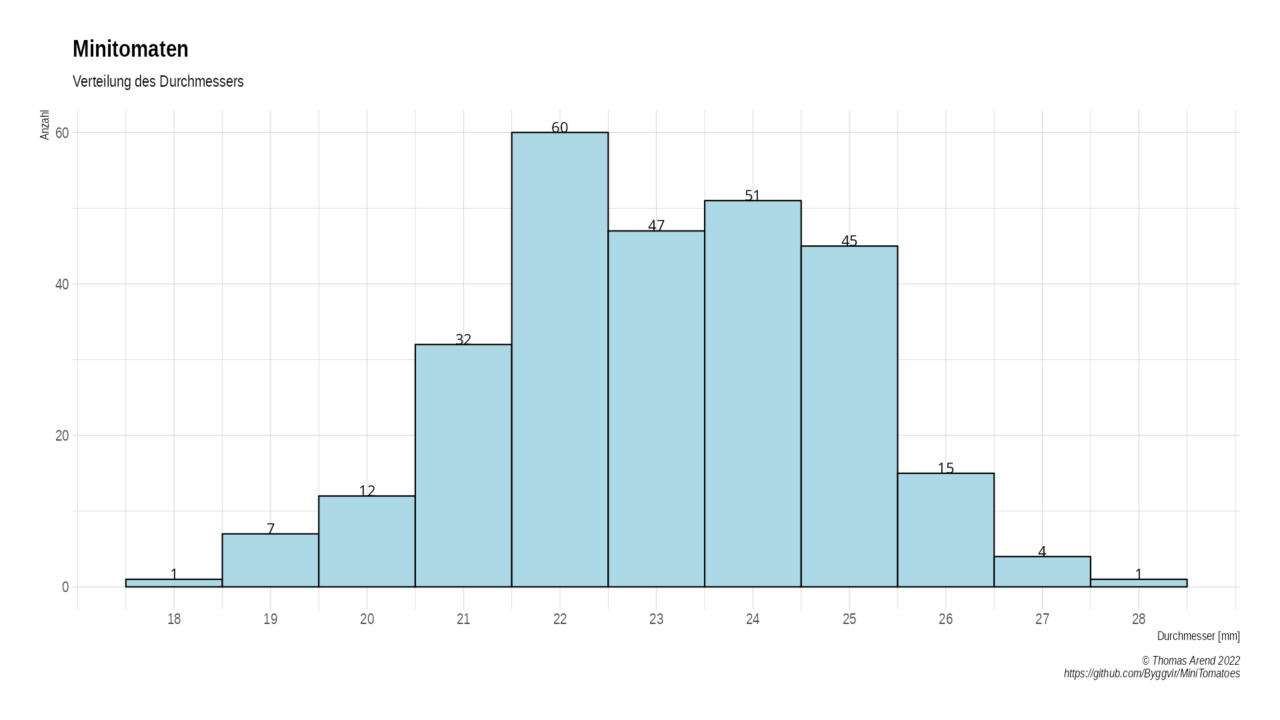
Mean diameter: X = 23.0890 mm
Median diameter: 23.10 mm
Standard deviation of diameter: s = 1.7885 mm
A histogram can be created for each characteristic to visualize the distribution of the data:
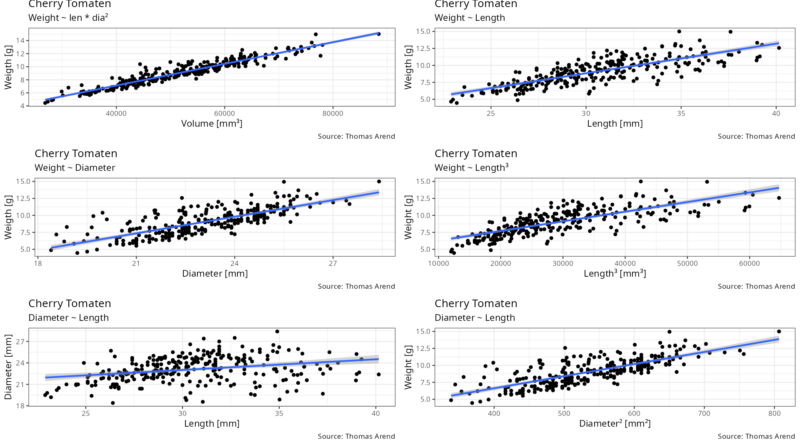
In addition, scatterplots can be created to visualize the relationship between the weight, length, and diameter of the mini tomatoes:
The mean, median, and standard deviation provide valuable information about the characteristics of the mini tomatoes in the sample. The mean and median are useful for determining the typical weight, length, and diameter of mini tomatoes, while the standard deviation indicates the degree of variability in the data. The histograms provide a visual representation of the distribution of the data, while the scatterplots show any relationships that may exist between the weight, length, and diameter.
Conclusion
A 500 gram can contains about 55 mini tomatoes.
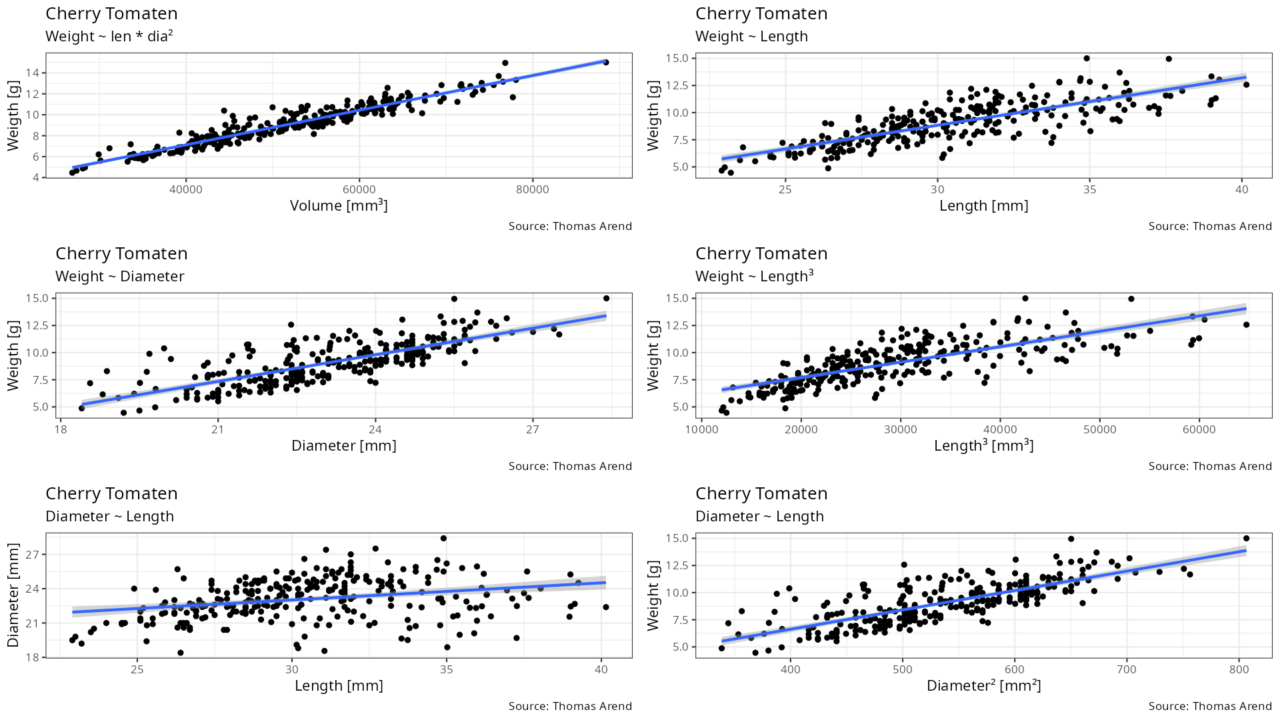
The best relationsship exists twetween weight and the product of length and diameter squared. So the weight is aproximately.
weight ~ 0.5016233618 + 0.0001655634 * (len * dia^2)In conclusion, examining the weight, length, and diameter of mini tomatoes is a valuable exercise that provides useful information about the fruit. The mean, median, and standard deviation are important metrics that can be used to better understand the characteristics of mini tomatoes, and the histograms and scatterplots provide a visual representation of the data that can be helpful for identifying patterns and trends.

Neueste Kommentare